Our Take
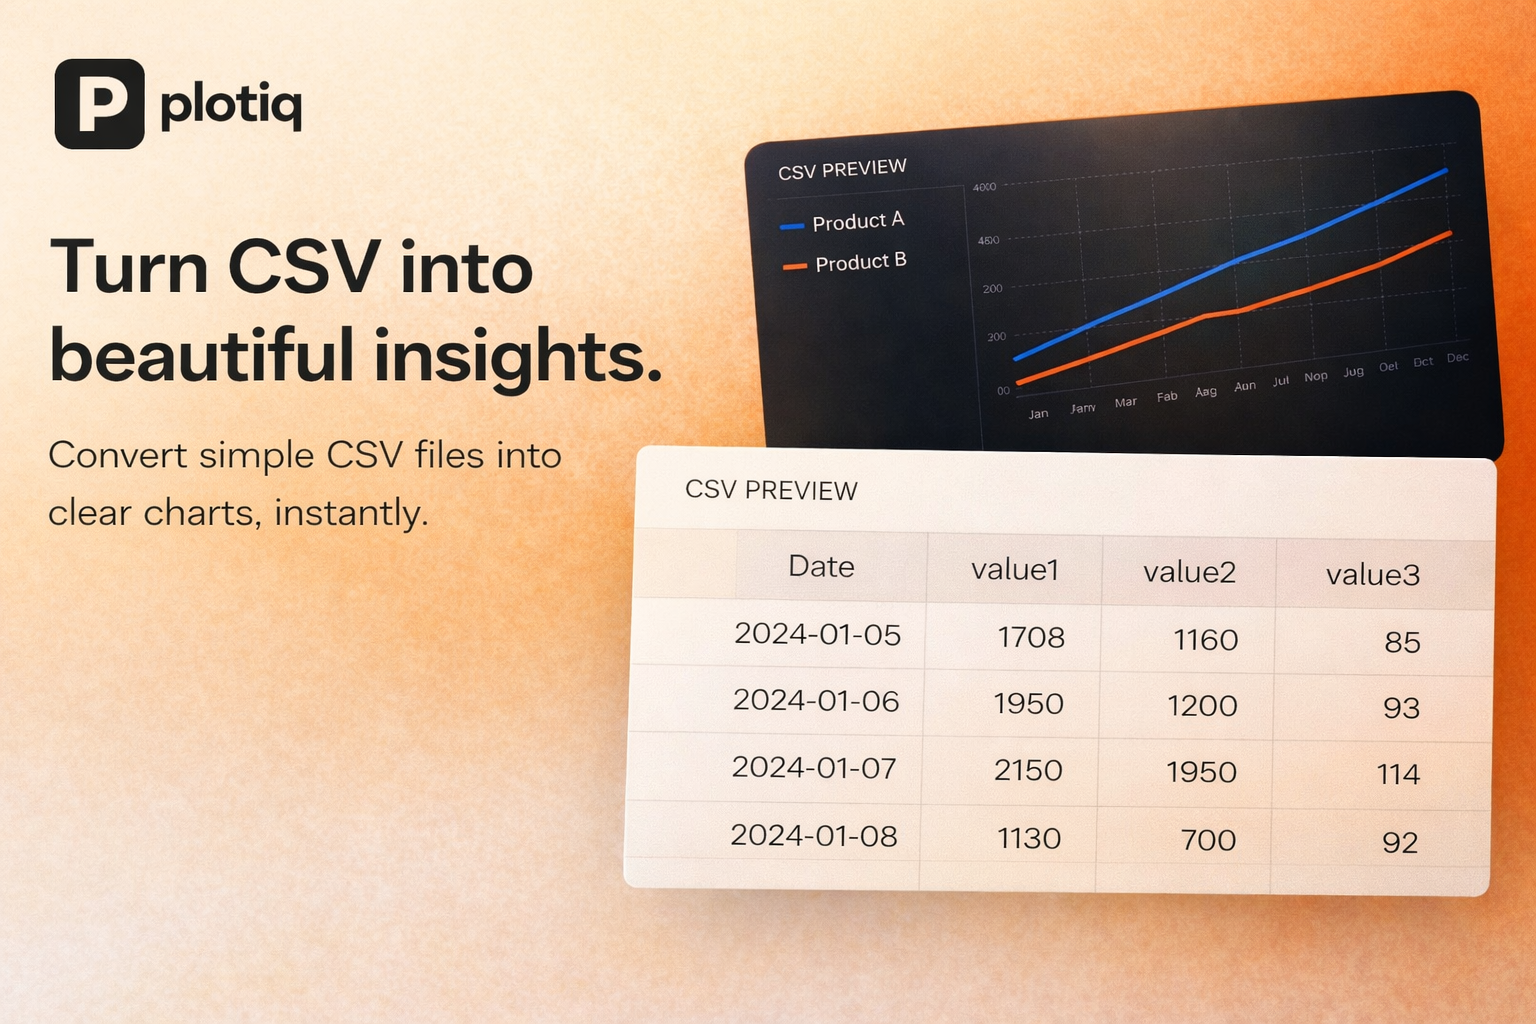
Plotiq is what happens when someone finally said "enough" to the Excel/Python dance people do every time they want to visualize data. You upload a CSV—literally just drag and drop—and it spits out charts. No setup, no code, no wrestling with formatting. Just data in, visuals out.
It's still early days—currently on Product Hunt where it's picking up traction—but the use case is obvious: everyone who's ever Googled "how to make a chart from Excel" is Plotiq's target customer. If you've ever spent more time formatting a chart than actually analyzing the data, this one's for you.
Key Facts
Category
martech
Discovered via
product-hunt
Links
Similar products worth knowing
Want products like this in your inbox every morning?
Five products. Every morning. Written by someone who actually cares whether they're good or not. Free forever, unsubscribe whenever.


